Overview
You can identify weak spots of your team's performance from the Insights page when you know how the metrics are calculated and can interpret each metric within it. This article explains how to interpret the metrics included in the 'General' section of Kayako's Insights pages. Below, we'll go through the definitions for each metric on the 'Conversations', 'Agents', and 'Teams' pages.
Prerequisites
- To access Insights in Kayako, you will need an agent or admin account with the "Can access insights" permission.
Solution
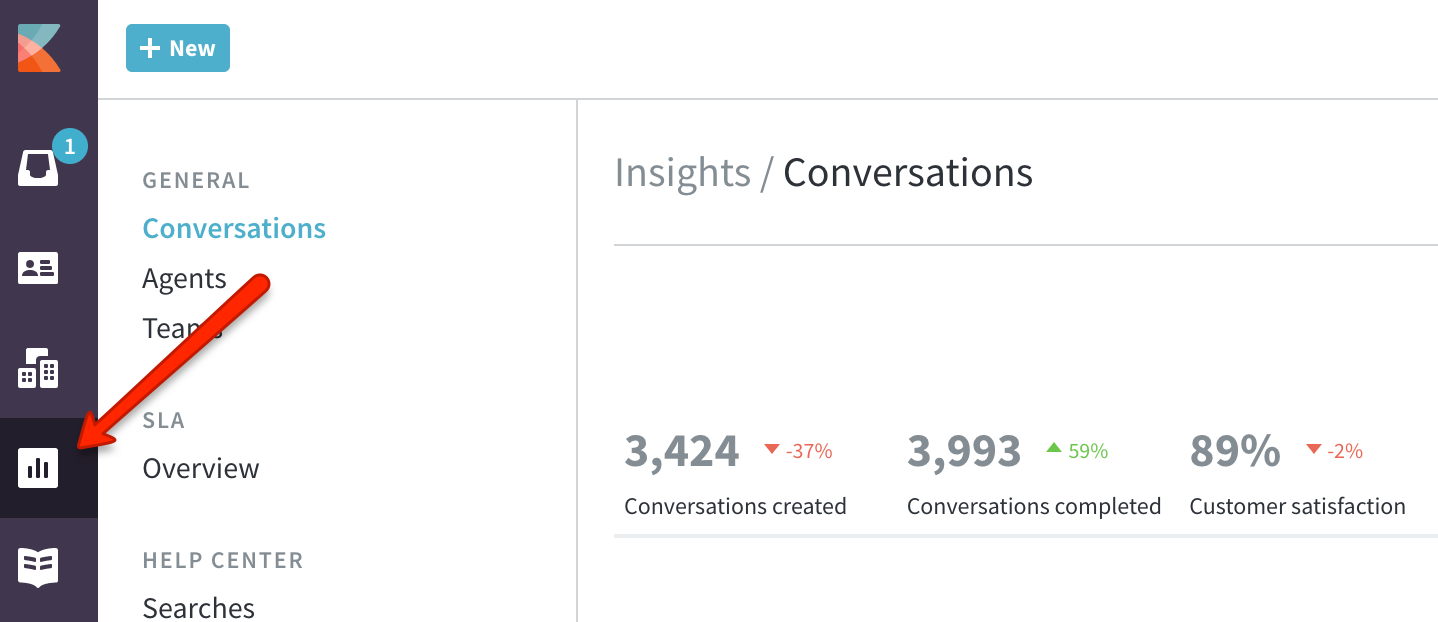
From the agent area in Kayako, you can access Insights by clicking the chart button on the left-hand sidebar.
General Insights for Conversations, Agents, and Teams
The first three Insights pages fall under the 'General' heading. Here, you can hone in on areas of improvement through key metrics on your conversations, individual agents, and teams. You can analyze team performance and gain a new perspective by viewing insights over different time periods.
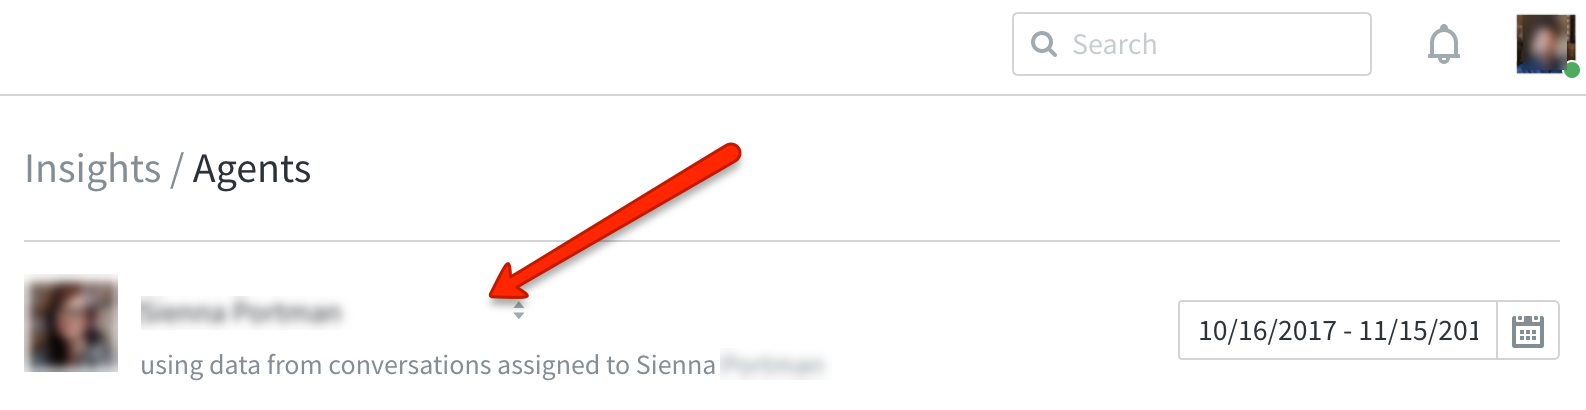
Each page in this section includes the same set of metrics, but on the 'Agents' and 'Teams' pages, you'll be able to see those statistics just for the conversations assigned to the agent or team you specify.
The reference table below shows the key metrics provided for conversations, agents, and teams.
| METRIC | DESCRIPTION |
|---|---|
| Conversations created | The number of conversations that were created (started). |
| Conversations completed | The number of conversations that were completed. |
| Customer satisfaction | The CSAT score calculated from completed conversations within the filtered period. |
| Customers helped | The number of unique customers communicated with (even if an agent or team worked on multiple conversations from the same customer). |
| Response time | The average response time (the time between each requester reply and the next agent reply) of conversations that were completed within the filtered period. |
| Resolution time | The average amount of time it took to complete conversations within the filtered period. |
| First contact resolved | The percentage of conversations that were completed within the filtered period after just one reply. |
| First response time | The average first response time of conversations completed within the filtered period. |
| Replies to resolution | The average number of replies exchanged in conversations that were completed within the filtered period. |
| First assignment time | The average amount of time it took to assign conversations that were assigned for the first time within the filtered period. |
| Team changes | The average number of assigned team changes for conversations assigned within the filtered period. |
| Total assigned* | The number of conversations that were assigned to this agent or team (and are still assigned) within the filtered period. |
| Conversations touched* | The number of conversations that this agent or team updated in some way. |
| Total public replies* | The total number of public replies (this excludes private notes). |
*These metrics are only available on the 'Agents' and 'Teams' pages.
Visualizations of Your Conversation, Agent, and Team Data
Below your key metrics are visual overviews of your team's core insights over a day, week, or month.
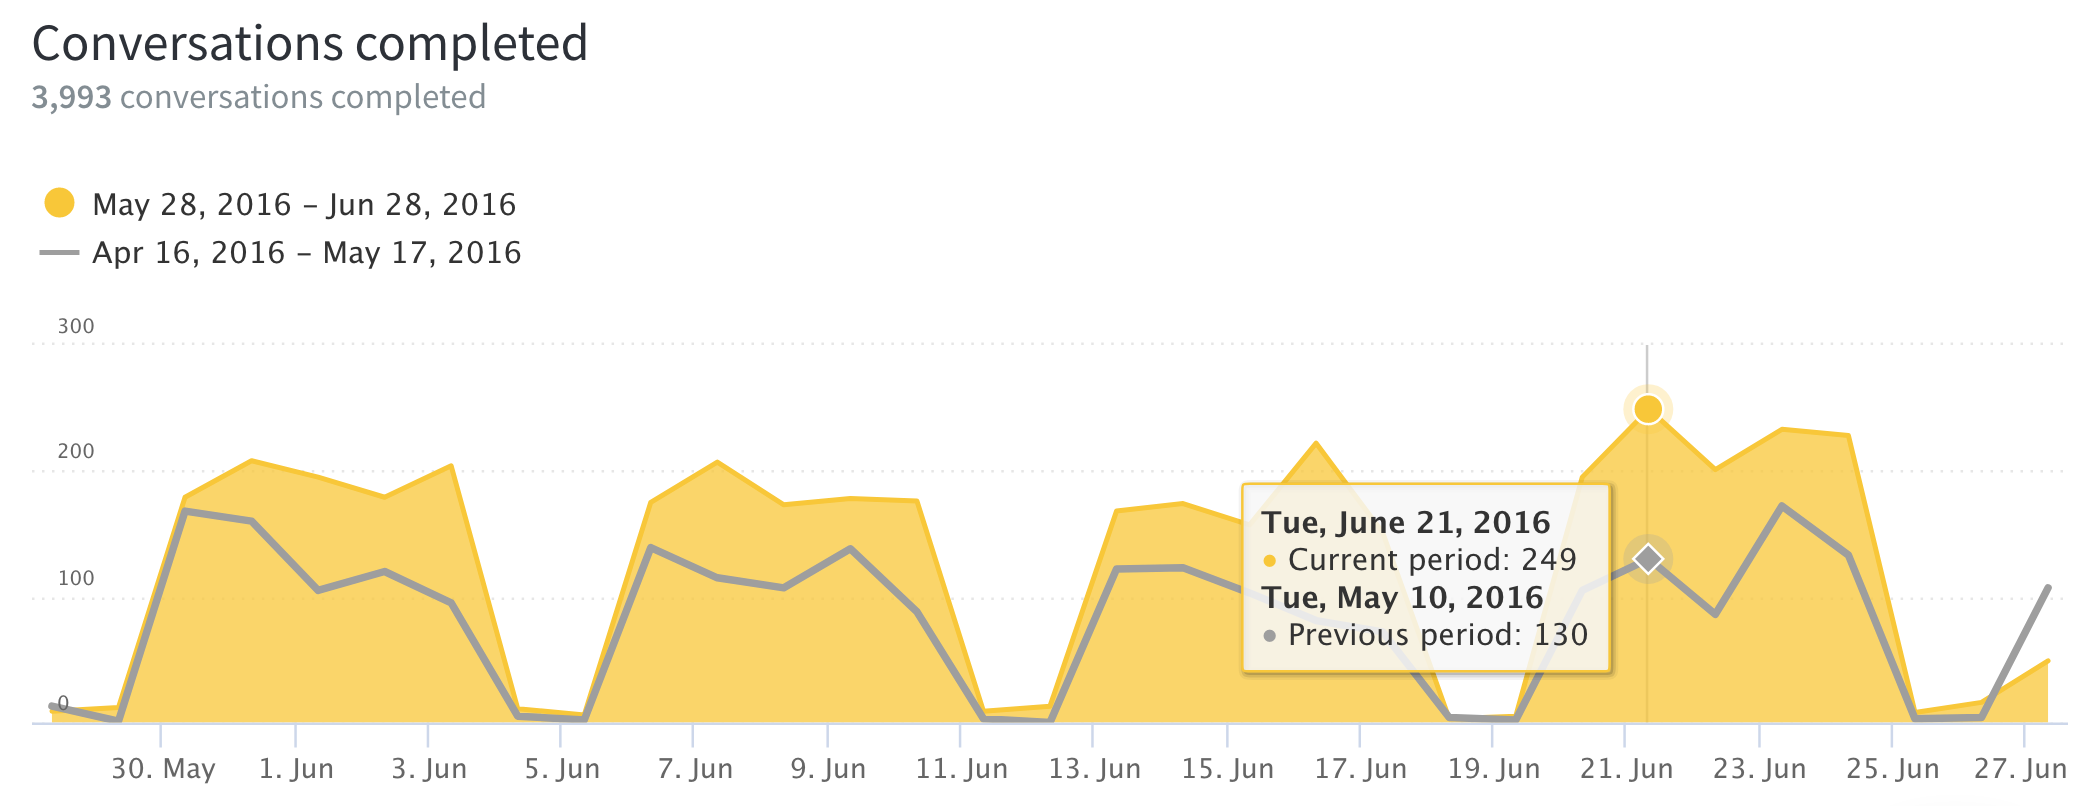
On each graph, you will see the current period's data (yellow) compared to the same data from the previous period (gray). The table below lists the kinds of graphs found in this section and their description. Time calculations displayed here are done based on the actual calendar rather than business hours. You can, however, obtain response times measured in Business Hours by generating Custom Reports.
There are four columns from a custom report that use Business Hours, and you can get a detailed list of all the columns in our article on Interpreting Custom Reports Columns. These four metrics are:
- Resolution Business Time
- Agent Average Business Response Time
- Agent First Business Response Time
- Agent Last Business Response Time
| METRIC | DESCRIPTION |
|---|---|
| Conversations completed | The number of conversations that were completed during the selected timeframe. |
| Average response time** | The average response time (time between each customer message and the next agent reply) of conversations that were completed within the filtered period. |
| Average resolution time** | The average amount of time it took to complete conversations within the filtered period. |
| Messages received** | The total number of posts received within the period. Click on the options below the graph to toggle channels. |
| Customer satisfaction score* | The CSAT score calculated from completed conversations assigned to the agent or team within the filtered period. |
* These metrics are only available on the 'Agents' and 'Teams' pages.
** These metrics are only available on the 'Conversation' page.
Agent and Team SLA Performance Metrics
On the 'Agents' and 'Teams' pages, you'll see an extra two graphs at the bottom of the page. These display data on your agent's or team's overall and specific SLA target performance.
To view your agent or team metrics for a specific SLA plan, select the plan from the dropdown. The percentage indicators beside each metric determine if you hit (green) or missed (red) the target SLA performance for that plan over a period of time.
SLA performance is measured using three benchmarks:
- First reply time — The time between when the conversation is created and when your support staff sends their first reply.
- Next reply time — The time between when the customer updates the conversation and your support staff sends their response. This will reset every time your staff updates the conversation.
- Resolution time — The time between when the conversation was created and when it's set to 'Completed'.
The reference table below shows a breakdown of each of your target performance metrics for each SLA plan.
| METRIC | DESCRIPTION |
|---|---|
| Percentage target achieved | The target achievement rate for conversations where this agent or team was the assignee. |
| Target breaches | The total number of target misses for conversations where this agent or team was the assignee. |
| Time to target | The average amount of time it took to meet the target for conversations where this agent or team was the assignee. |
| Breaches overdue by |
The average amount of time over a target, for conversations which missed their target while the agent or team was assigned. |
Testing
Sign in to the agent area and click on the Insights icon on the sidebar so you can start perusing your metrics or create a custom report!
Related Articles
ATLAS
Comments